

CLIPS
How AI Empowers Underserved Communities
Building Communities Through Educator Empowerment
Students Use AI for Greener Bronx Spaces
Why Communities Must Master Their Own AI Tools
RomoGIS
Frank Romo is an inspiring leader in geospatial. He runs several educational programs with school students across the country such as in The Bronx and recently St Louis. The focus of episode was therefore on how AI is being used to facilitate better outcomes for students. Frank gave examples from his community organising work such as urban planning and urban design renderings in The Bronx, gathering data for geospatial projects, and as a study aid by creating a quiz to help pass the Part 107 drone pilot license.
Frank is a joy to talk with. He is such a breath of fresh air because of the concerted efforts he makes to be approachable to all. He dresses the part. It is deliberately memorable and contrasts strongly with typical office dress. He wears a bandana in some of the photos with students. As such, he brings an atmosphere of fun, informality and through this it is easier to generate engagement with students and adults alike regarding what can often be a dry subject - drawing maps with databases.
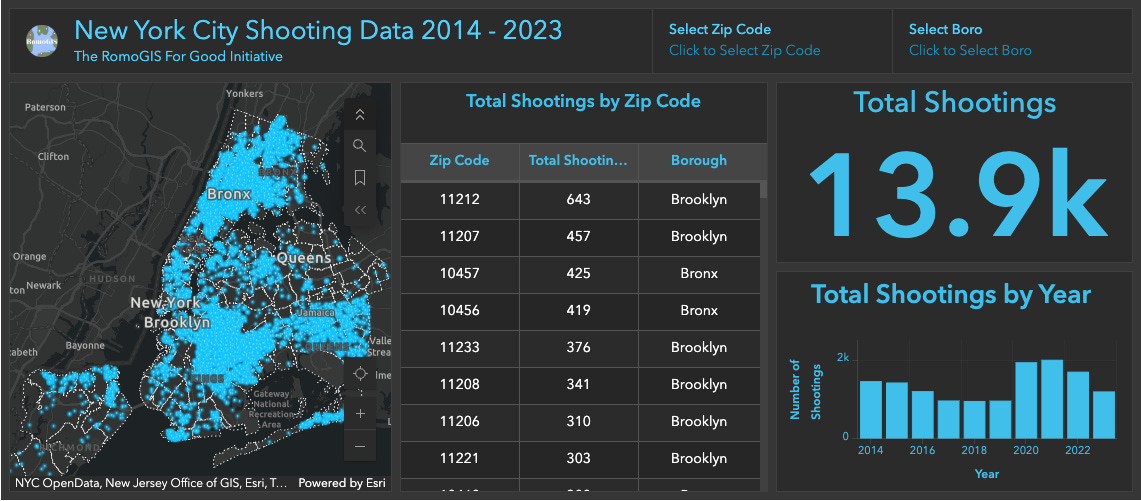
In the first episode I recorded with him, he publicly displayed for the first time a dashboard about gun violence in The Bronx, created during a RomoGIS community organising effort. First episode:
The Bronx gun violence dashboard is here:
We are once again seeing, in this subsequent episode with him, the first public display of another dashboard from further community organising efforts. This is a dashboard about A Decade of NYC Shootings (2015 - 2024):
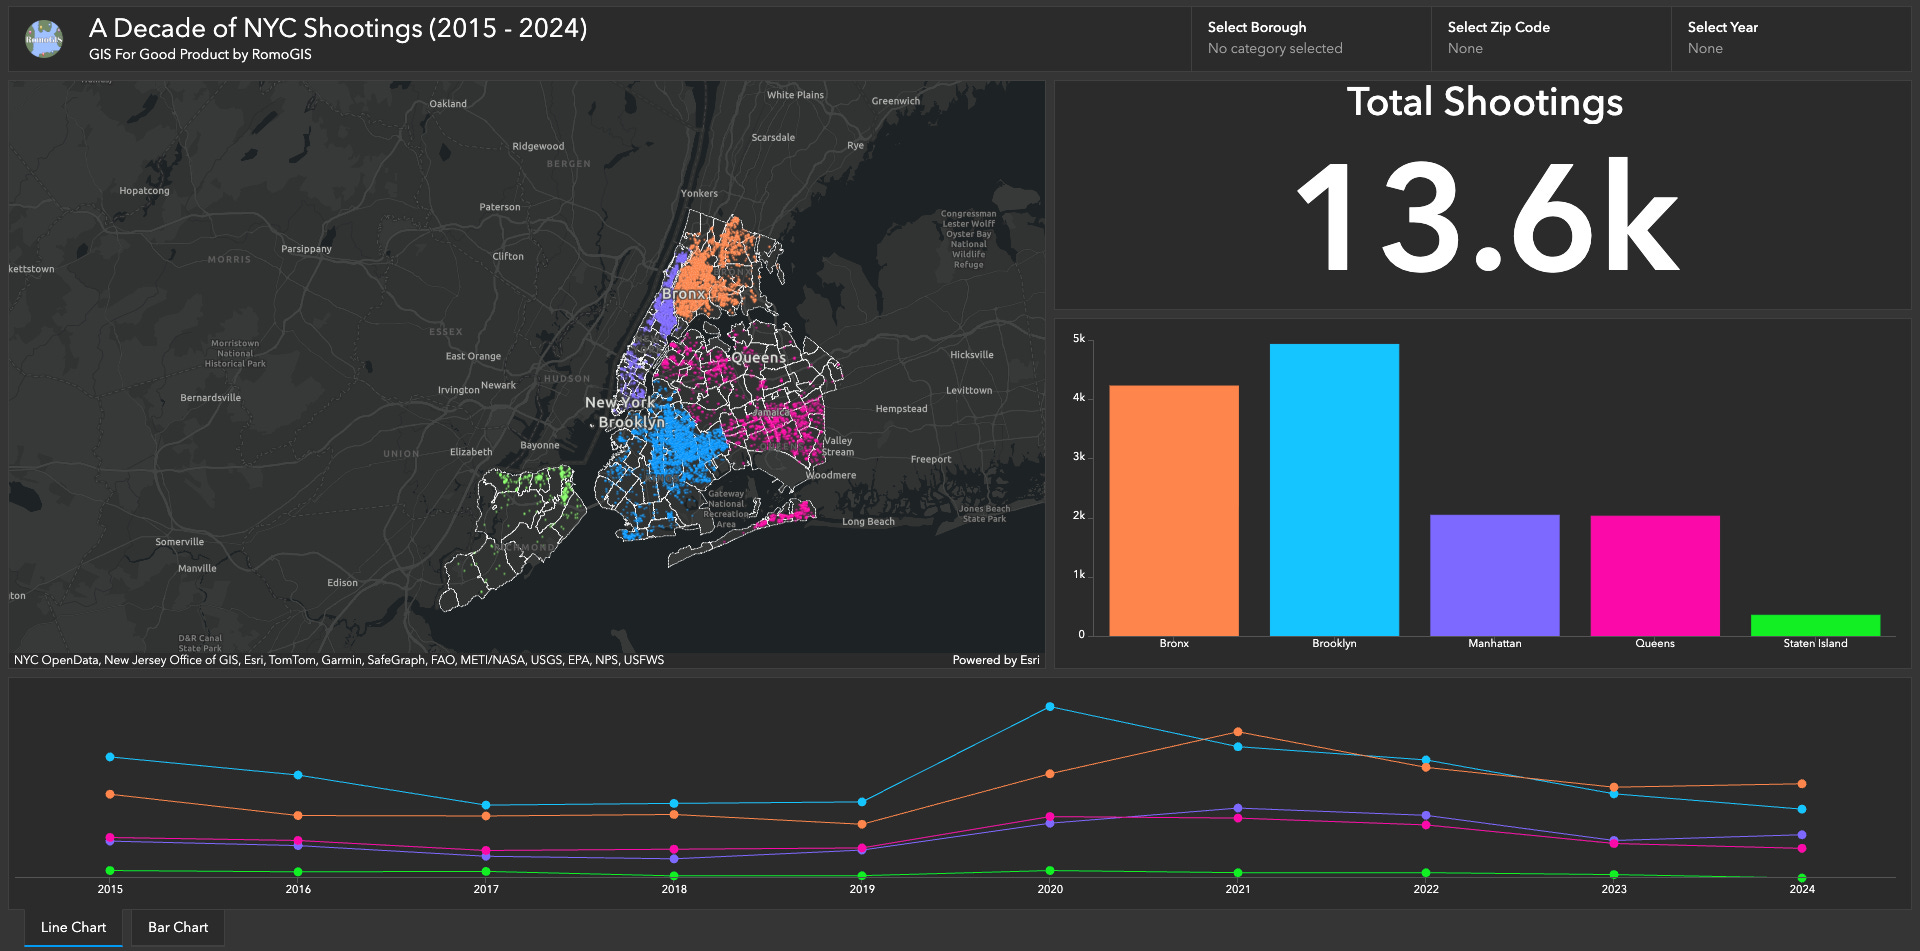
In Frank's own words:
This project transforms ten years of NYPD shooting incident data into an interactive app that reveals where gun violence has occurred in New York City between the years of 2015 to 2024. The data was processed by RomoGIS with data sourced from the NYC Open Data Portal. This app is designed to inform community safety initiatives and policy interventions as part of RomoGIS' GIS For Good Initiative to end Gun Violence (www.gisforgood.com, https://gunviolence-romogis.hub.arcgis.com/).
Frank is a leader. We are privileged to have his time.
